Data Visualization
-

Learn the intuition behind time series decomposition, additive vs. multiplicative models and build your first…
12 min read -

Can Python really replace JavaScript for web development?
5 min read -

Leverage the power of the Metadata API to act on any potential data disruptions
14 min read -

Billions, visualized to scale using python and HTML
6 min read -
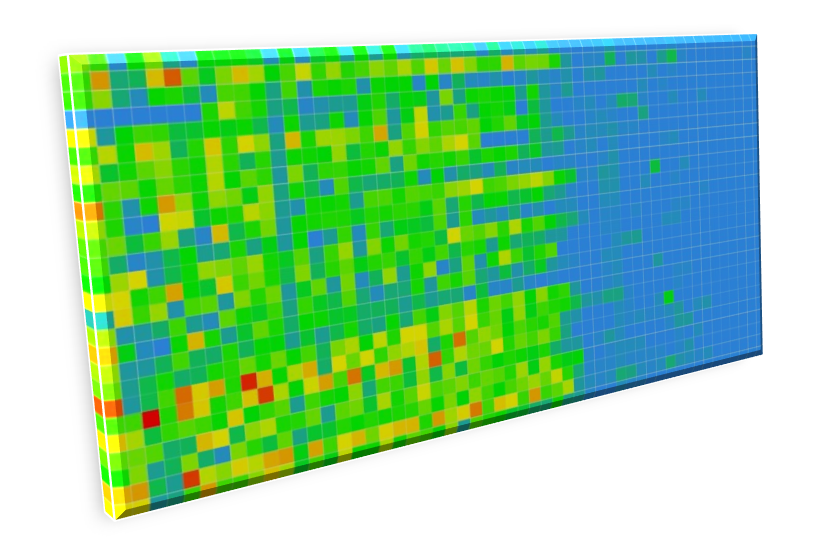
Visualizing trends and outliers with non-linear color scales
8 min read -
A deep dive into the ways data can be used to misinform the masses
9 min read -

An overly-enthusiastic application of science and data visualization to a question we’ve all been asking
22 min read -

Complete Tutorial to Automate 3D Data Visualization. Use Python to convert point clouds and 3D…
19 min read -

Bubble charts elegantly compress large amounts of information into a single visualization, with bubble size…
9 min read -

Introduction “Money can’t buy happiness.” “You can’t judge a book by its cover.” “An apple…
10 min read